
This post is a preview of Production Ready GraphQL, a book I recently released on building GraphQL servers that goes into great detail on building GraphQL servers at scale: https://book.productionreadygraphql.com
Measuring API performance is very important to get right, and GraphQL doesn’t make it any less important. In fact, some of you are maybe using GraphQL because of performance concerns and replacing multiple calls with a single GraphQL call. But are your GraphQL queries actually faster? This is why it’s important to monitor them.
If you’re used to endpoint-based HTTP APIs, you might have done some monitoring successfully before. For example, one of the most basic ways of monitoring performance for an API is to measure response time. We may have some dashboards that look like this.
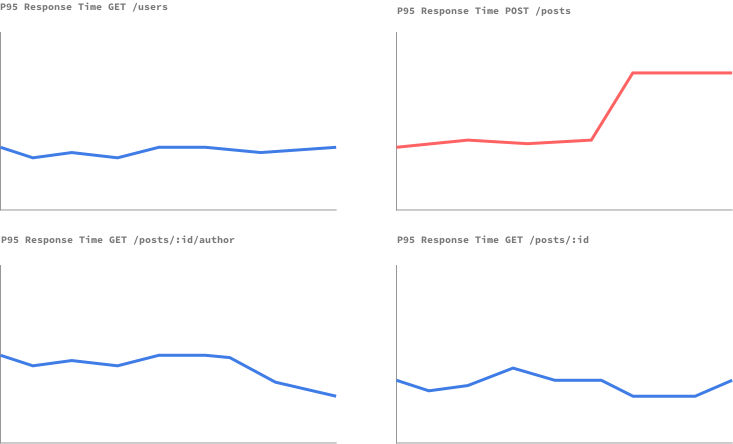
Monitoring our APIs like this allows us to quickly catch a subset of the API that is having issues. For example, in the example above, something seems to be off with the POST /posts endpoint. So our first instinct might be to approach a GraphQL API the same way.
Unfortunately, we quickly discover that measuring response time of a GraphQL endpoint gives us almost no insight into the health of our GraphQL API. Let’s see why by looking at a super simplified example. Imagine you maintain a GraphQL API that currently serves a simple query:
query {
  viewer {
    name
    bestFriend {
      name
    }
  }
}
Now a new API client starts using our GraphQL API, but has different, much larger needs:
query {
viewer {
friends(first: 1000) {
bestFriend {
name
}
}
}
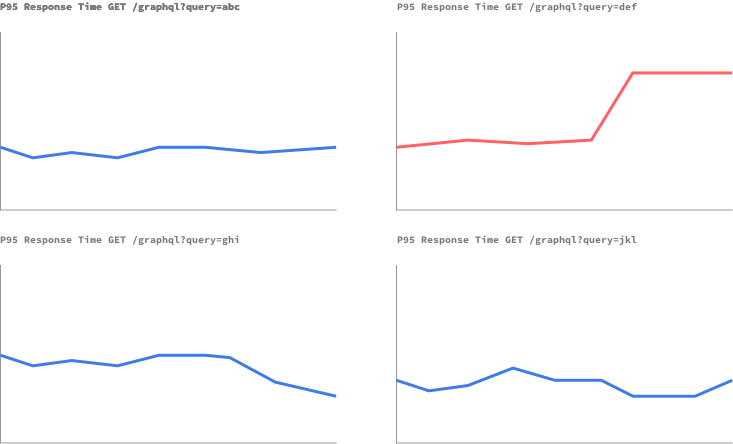
}Notice how the query strings are not so far from each other, but the second one is actually requesting more than a hundred objects, while the first one is only querying for one. If you were monitoring the GraphQL endpoint, you would see your response time spike by a lot. This is because indeed, responses we return are a bit slower because we simply serve more complex queries! Most of us are not actually interested by this, but would rather know if the performance degraded given the same usual load/use cases.
In fact, we are not interested in monitoring the endpoint, but the *queries. - We want to know if a query that a user used to run in 200ms now takes 500ms to run. If you’re the maintainer of a private API, with a small set of known clients and a small set of queries, we could actually just do that — monitor known queries for their performance. This is even easier with “persisted queries”:
However, if you’re managing a public API, or a very large internal API with a larger set of clients and queries, this may not be easy to do, due to the high cardinality of queries. We must then find other ways.
Monitoring Per-Field
A common approach is to change our mindset from monitoring queries, to monitoring resolvers, where individual fields are computed. We could then quickly see if field is acting slow. There’s a major problem with this approach that makes it very hard to use this approach to accurately monitor the performance of GraphQL APIs: lazy/batch loading (<- I recommend you read this if you haven’t heard of it before).
With dataloader style libraries, the time a resolver takes to compute a field doesn’t tell the whole story.
def my_resolver
  load_one_million_things.then do |a_million_things|
    a_million_things.map { |thing| thing.name }
  end
end
If we measured the timing of this resolve method, we would probably see it resolved very fast, and that would be true! Using lazy loading, the method asked to load a million objects, but instantly returned a promise. A query using this field would probably be quite slow, but we wouldn’t instantly know why. That’s because depending on which library you’re using, maybe another field ended up kicking the loading process, or maybe it was even outside of resolvers.
If you’re using asynchronous loading or similar execution strategies, chances are monitoring only resolvers won’t give you the data you’re looking for! Not only this, but fields often behave differently based on a number of things, like which parent field they were selected on 😨.
Alternative Approaches
As you can see, reliably monitoring the performance of a GraphQL server is quite a hard task, especially as a public API. There’s other approaches we’ve been considering. One of them is to try and analyze regressions in all possible queries. However one thing you’ll notice is not only do we need to take care of variations in queries, but also in variables, take a look at this query:
query ($num: Int) {
  friends(first: $num) {
    name
  }
}
We can probably affect the execution time of this query string by passing a different value for the $num variable. We can quite easily guess that getting only 1 friend is much faster than getting 1000 friends for example.
Really, what we’re looking for are regressions or anomalies in a pair of query + variables. If getting exactly 50 friends is getting slower and slower, there’s probably a problem. I’m not aware of any tool that allows you to do that at the moment, but it’s something you could build yourself if you have the tools for it. We could track the execution of these pairs every day, store these results, and analyze regressions this way.
Anomaly Detection
I’m also really interested in how we can determine if the response time from a GraphQL endpoint was too slow for a particular query. Something like a slow query log could be built, to help engineers find out which queries run problematically slow.
In fact, I’ve often wondered if we could find a relationship between query complexity, and query execution time. If we find out that they are related in a particular way, we could in theory detect anomalies. For example, a low complexity query with a high execution time may be a sign that we need to take a good look at the execution of the query.
GraphQL monitoring at a large scale is really hard. Not many tools exist to help us with some of these problems right now, but I’m hopeful we’ll explore smarter ways to get insight from execution performance for GraphQL, stay tuned!
I’m working on a book on this stuff :) If you’re interested, please sign up for more updates and to know when it comes out 💜 Hopefully by the time it ships, I’ll include how you can build or use some of these more advanced monitoring solutions. https://book.productionreadygraphql.com